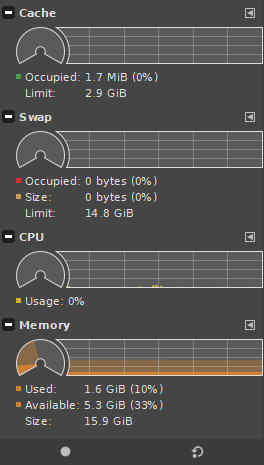
The Dashboard helps to monitor GIMP resource usage (Cache, Swap, CPU, Memory). This allows you to make more educated decisions about various configuration options, especially System Resources. It is also used by developers.
This dialog is a dockable dialog; see the section Розділ 2.3, «Dialogs and Docking» for help on manipulating it.
Доступ до вікна можна отримати так:
-
за допомогою пункту головного меню → → ;
-
за допомогою меню вкладки у будь-якому швартованому вікні шляхом натискання кнопки меню вкладки
і вибору пункту → .
The Dashboard consists of five groups that you can monitor: Cache usage, Swap usage, CPU usage, Memory usage, and Misc information. By default the Misc group is hidden and the CPU and Memory groups are collapsed.
Each group has a separate Tab menu where you can change settings related to that group.
At the bottom of the Dashboard are two buttons, which will be explained in the Dashboard context menu, where these commands are also available.
- Контекстне меню панелі приладів
-
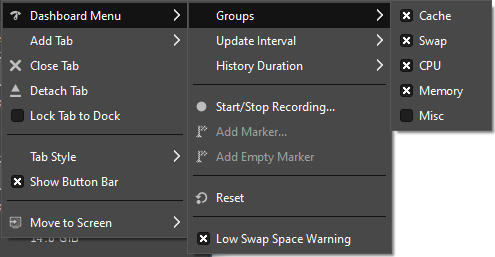
This context menu allows you to change what groups are visible, some other settings related to the Dashboard, as well as a few Dashboard related commands.
- Підменю «Групи»
-
The Groups submenu allows you to change what groups are visible. By default , , and are visible, and is hidden, but you can choose to show or hide any of these here.
- Підменю «Інтервал оновлення»
-
The Update Interval submenu allows you to change how often the information shown in the Dashboard is updated. The default is 0.25 seconds, but you can change this to a longer period up to 4 seconds.
- Підменю «Тривалість ведення журналу»
-
The History Duration submenu allows you to change for what period of time the information is shown. The default is 60 seconds, but you can choose from values between 15 and 240 seconds.
- Почати/Припинити записування…
-
This is also available as a button at the bottom of the Dashboard. This allows you to start or stop recording a performance log. In certain situations the developers may ask you to supply this log if you are experiencing performance related issues. This log can help them to figure out the problem. When you start recording you will be asked to select a location and filename where the log will be saved.
- Додати позначку…
-
If you are recording a performance log, this enables you to mark a certain event in the log. You will be asked to give a name to this event. This can make it easier for developers to find the problem area in your log, because logs can become fairly large. This is also available as a button at the bottom of the Dashboard when you are recording a performance log.
- Додати порожню позначку…
-
If you are recording a performance log, this enables you to mark a certain point in the log. An empty marker will be added, meaning you won't be asked to give it a name. This can make it easier for developers to find the problem area in your log, because logs can become fairly large. When you are recording you can also use the button at the bottom of the Dashboard while pressing the Shift key to add an empty marker.
- Скинути
-
Reset cumulative data removes the performance data and starts from zero. This is also available as a button at the bottom of the Dashboard when you are not recording a performance log.
- Попередження щодо малого об'єму резервної пам'яті…
-
If this option is enabled, the Dashboard will be raised to the top if your swap space is nearing the limit.
Тепер надамо пояснення щодо кожної групи окремо.
- Кеш
-
Cache shows what part of the tile cache, the size of which can be set in System Resources preferences, is currently being used. If your cache is often near the maximum, and you have enough available memory, you could consider increasing the cache size.
By default this shows the currently occupied part of the Cache, and the maximum cache size as set in preferences. What is shown can be changed in the Cache tab menu by clicking on
. You can choose to show or hide Occupied size, Maximum size used since you started measuring, the cache Limit, the Compression ratio, and Hit/Miss ratio.
- Резервна пам'ять
-
Swap shows the current size of the on-disk tile swap, and what part of that is currently being used. It also shows the swap size limit. If your swap is often being used, and you have enough available memory, you could consider increasing the cache size.
By default this shows the current Swap size and what part is occupied, as well as the Swap size limit. What is shown can be changed in the Swap tab menu by clicking on
. You can choose to show or hide the Occupied size, the current swap file Size, the swap file size Limit, the Queued size (the amount planned to be written to the swap file), Read is the total amount read from the swap file, Written is the total amount written to the swap file, and the Compression ratio of the data written to the swap file.
- Процесор
-
У пункті «Процесор» буде показано дані щодо поточного використання процесора.
By default this shows the current CPU usage. What is shown can be changed in the CPU tab menu by clicking on
. You can choose to show or hide CPU Usage, and the total amount of time the CPU has been Active.
- Пам'ять
-
Memory shows the current amount of memory used by GIMP, the amount of available (free) physical memory, and the total size of your physical memory.
What is shown can be changed in the Memory tab menu by clicking on
. You can choose to show or hide the occupied tile Cache, the total size of the Tile memory, the amount of memory Used, the size of the Available physical memory, and the physical memory Size.
- Інше
-
The Misc group is not shown by default, but has to be enabled in the Dashboard context menu first. It shows extra information mainly useful for developers.
By default all settings are shown, but what is shown can be changed in the Misc tab menu by clicking on
. You can choose to show or hide total size of processed Mipmapped data, the number of Assigned worker threads, the number of Active worker threads, the number of Async (asynchronous) operations, the total size of Tile memory, the total size of Scratch memory, and the total size of TempBuf (temporary buffers).


