Dashbordet hjelper til med å overvåka ressursbruken i GIMP (buffer, vekselminne, CPU, minne). Dette let deg ta meir fornuftige avgjerder om dei ulike konfigurasjonsalternativa, spesielt Systemressursar. Det vert også brukt av utviklarane.
Dette er eit dokkpanel som kan limast inn i andre dokkpanel. Sjå nærare om dette i Del 2.3, «Dialogvindauge og dokkpanel».
Du har tilgang til det:
-
frå hovudmenyen via → → ,
-
frå fanemenyen i eit anna dokkpanel ved å klikka på fanemenyknappen
 og velja → .
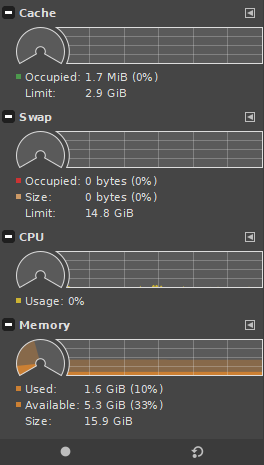
Dashbordet inneheld fem grupper som du kan overvåka: bruk av bufferlager, bruk av vekselminne, bruk av CPU, minne-bruk, og ymse informasjon. Som standard er ymse-gruppa gøymd, saman med CPU- og minne-gruppene.
Kvar gruppe har åtskilde fanemenyar der du kan endra innstillingane relaterte til den gjeldande gruppa.
Nedst i dashbordet er det to knappar som vert forklarte i sprettoppmenyen for dashbordet der dei også er tilgjengelege.
- Sprettoppmenyen for dashbordet
-
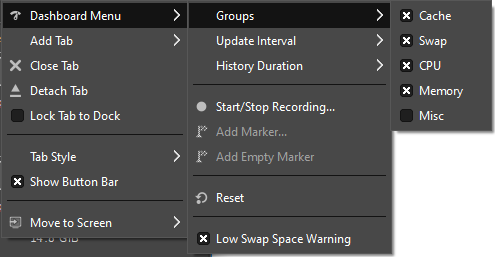
Sprettoppmenyen gjev deg høve til å endra kva grupper som skal vera synlege og nokre andre innstillingar relaterte til dashbordet. I tillegg nokre få dashbordrelaterte kommandoar.
- Undermenyen for grupper
-
I gruppemenyen kan du endra kva grupper som er synlege. Som standard er gruppene , , og synlege og gøymd, men du kan endra dette her etter behov.
- Undermenyen «Oppdater intervall»
-
Undermenyen «Oppdater intervall» vert brukt for å setja kor ofte informasjonen vist i dashbordet skal oppdaterast. Standard er 0,25 sekund, men du kan setja dette opp til 4 sekund.
- Undermenyen «Historietidslengd»
-
Du kan bruka undermenyen for «Historietidslengd» for å setja kor lenge informasjonen skal visast. Standard er 60 sekund, men du kan setja denne mellom 15 og 240 sekund.
- Start / Stopp opptak …
-
Denne er også tilgjengeleg som ein knapp nedst på dashbordet. Dette let deg starta eller stoppa registreringa av ein ytingslogg. I visse situasjonar kan utviklarane be deg om å gje op denne loggen viss du opplever ytingsrelaterte problem. Denne loggen kan hjelpa dei med å finna ut av problemet. Når du startar opptaket, vert du beden om å velja ein stad og filnamnet der loggen skal lagrast.
- Legg til markør …
-
Viss du tek opp ein ytingslogg, let dette deg merkja ei bestemt hending i loggen. Du vert beden om å gje eit namn på hendinga. Dette kan gjera det lettare for utviklarane å finna problemområdet i loggen din, fordi loggane kan verta ganske store. Denne er også tilgjengeleg som ein knapp nedst på dashbordet når du tek opp ein ytingslogg.
- Legg til tom markør …
-
Viss du registrerer ein ytingslogg, kan du her markera eit bestemt punkt i loggen. Ein tom markør vert lagt til, noko som betyr at du ikkje vert beden om å gje han eit namn. Dette kan gjera det lettare for utviklarane å finna problemområdet i loggen din, fordi loggane kan verta ganske store. Når du spelar inn, kan du også bruka knappen nedst på dashbordet medan du trykkjer på Shift-tasten for å leggja til ein tom markør.
- Tilbakestill
-
Når du tilbakestiller kumulative data vert ytingsdataa fjerna og byrjar frå null. Denne er også tilgjengeleg som ein knapp nedst på dashbordet når du ikkje tek opp ein ytingslogg.
- Åtvaring om lite plass for vekselmappa …
-
Når denne er merkt, vert dashbordet løfta til toppen når storleiken på vekselmappa nærmar seg grensa.
Vi vil no forkalar kvar gruppe for seg.
- Mellomlager
-
Mellomlageret viser kva del av flisbufferen, som er i bruk nett no. Storleiken på mellomlageret kan visast i System Resources-preferansene. Viss mellomlageret ofte er nær maksimum og du har nok tilgjengeleg minne, bør du vurdera å auka storleiken på mellomlageret.
Til vanleg viser dette kor mykje av mellomlageret som er i bruk og den største storleiken på mellomlageret sett i innstillingane. Kva som vert vist, kan endrast i fanemenyen for mellomlageret ved å trykkja på
. Du kan velja å visa eller gøyma Brukt storleik, Maksimum storleik brukt sidan du byrja å måla, Grense for minnet, Komprimering og forholdet mellom Treff/Bom. - Vekselminne
-
Vekselminne viser den noverande storleiken på flisvekselminnet på harddisken og kva del av dette som er i bruk. Også grensene for vekselminnet vert vist. Viss vekselminnet ofte er i bruk og du har nok ledig plass, bør du vurdera å auka storleiken på mellomlageret.
Som standard viser dette den gjeldande storleiken på vekselminnet og kva del som er i bruk, men også grensene for denne storleiken. Du kan endra kva som skal visast i fanemenyen for vekselminnet ved å trykkja på
. Du kan velja å visa eller gøyma storleiken Brukt, Storleik på den gjeldande vekselfila, Avgrensingar for storleiken på vekselfila, storleiken på Kø (mengda planlagt å skrivast til vekselfila), Lese som er den totale mengda lese frå vekselfila, Skrive som er den totale mengda skrive til vekselfila og Kompresjon-forholdet for dataa skrive til vekselfila. - CPU
-
CPU viser gjeldande bruk av CPU-en.
Normalt viser dette den gjeldande bruken av CPU. Kva som vert vist kan endrast i fanemenyen CPU ved å trykkja på
. Her kan du visa eller gøyma Bruk av CPU og kor lenge CPU-en har vore i bruk. - Minne
-
Minne viser kor mykje minne GIMP brukar nett no, kor mykje tilgjengeleg (fritt) minne og storleiken på det fysiske minnet i datamaskinen.
Du kan endra kva som skal visast her frå fanemenyen for minne ved å trykkja på
. Du kan velja å visa eller gøyma Buffer, totalstorleiken på Flis-minnet, kor mykje minne som erBrukt, storleiken på Tilgjengeleg fysisk minne og Storleik på det fysiske minnet i alt. - Ymse
-
Gruppa «Ymse» vert til vanleg ikkje vist, og må gjerast tilgjengeleg i sprettoppmenyen for dashbordet først. Informasjonen her er stort sett meint for utviklarane.
Til vanleg vert alle innstillingane viste, men du kan endra kva som skal visast ved å trykkja på
. Du kan velja å gøyma eller visa totalstorleiken på handsama Mipmappa data, talet på Tildelte arbeidstrådar, talet på Gjeldande arbeidstrådar, talet på Asynk (asynkrone) operasjonar, den totale storleiken på Flis-minnet, den totale storleiken på Scratch-minnet og den totale storleiken påTempBuf (mellombels bufferar).


