Dialog Histogram zobrazuje informace o statistickém rozložení barevných hodnot v aktivním obrázku. Takové informace jsou neocenitelné například tehdy, když se snažíte obrázek barevně vyvážit. Histogram je ovšem skutečně pouze informační dialog, manipulace s ním nemůže obrázek nijak ovlivnit. Pokud chcete provést korekci barev na základě histogramu, použijte nástroj Úrovně.
This dialog is a dockable dialog; see the section 2.3 – „Dokování dialogů“ for help on manipulating it.
You can access it:
-
from the main menu: → → .
-
from the Tab menu in any dockable dialog by clicking the tab menu button
 and selecting
→ ,
and selecting
→ ,
-
from the main menu: → → .
In the menu, there is a list of detached windows which exists only if at least one dialog remains open. In this case, you can raise the „Histogram“ dialog from the main menu: → .
V GIMPu lze každou obrazovou vrstvu rozložit do jednoho nebo více kanálů: v případě RGB obrázku je to červený, zelený a modrý kanál, v případě obrázku ve stupních šedi je jediný kanál jasu. Vrstvy podporující průhlednost mají navíc tzv. alfa kanál. Každý kanál může obsahovat hodnoty v rozsahu od 0 do 255 (celá čísla). Černý pixel je proto reprezentován nulou ve všech barevných kanálech, bílý pixel číslem 255 ve všech barevných kanálech. Průhledný pixel nese hodnotu 0 v alfa kanálu, zcela neprůhledný pixel má naopak alfa hodnotu 255.
For RGB images, it is convenient to define a Value „pseudochannel
“. This is not a real color channel: it does not reflect any
information stored directly in the image. Instead, the Value at a pixel
is given by the equation V = max(R,G,B).
Essentially, the Value is what you would get at that pixel if you
converted the image to Grayscale mode.
Více informací o kanálech lze nalézt v části Práce s obrázky.
The active layer name is shown at the top of the dialog.
- Channel
-
The drop-down below the active layer name allows you to select which channel to use. The available options depend on the layer type of the active layer. Possible options are:
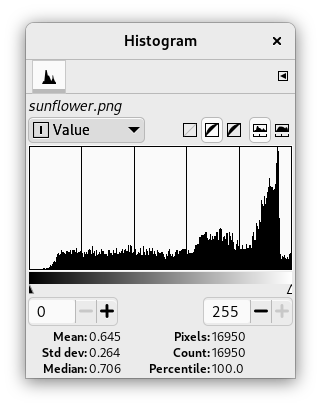
- Value
-
V případě RGB obrázků a obrázků v odstínech šedi. Představuje distribuci hodnot jasu ve vrstvě. V případě RGB obrázku jsou tyto hodnoty získány z pseudokanálu.
For an indexed image, the „Value“ channel actually shows the distribution of frequencies for each colormap index: thus, it is a „pseudocolor“ histogram rather than a true color histogram.
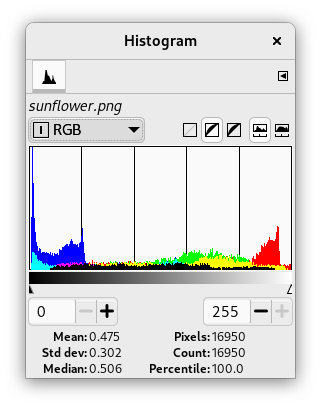
- Red, Green, Blue
-
Tyto možnosti jsou dostupné pouze v případě RGB obrázků. Zobrazují rozložení intenzit v červeném, zeleném a modrém kanálu.
- Alfa
-
This shows the distribution of opacity levels. If the layer is completely transparent (alpha = 0) or completely opaque (alpha = 255), the histogram will consist of a single bar on the left or right edge.
- Luminance
-
This shows the distribution of lightness intensity.
- YUV
-
Tato možnost, dostupná pouze pro RGB obrázky, zobrazuje červený, zelený a modrý histogram položený na sobě. Lze tak v jednom pohledu posuzovat rozložení veškeré barevné informace.
-
 Linear
,
Linear
,
 Non-Linear
,
Non-Linear
,
 Perceptual
-
These three buttons determine whether the tone reproduction (TRC) will be displayed using a linear, non-linear, or perceptual X axis.
-
 Linear histogram
,
Linear histogram
,
 Logarithmic histogram
-
These two buttons determine whether the histogram will be displayed using a linear or logarithmic Y axis. For images taken from photographs, the linear mode is most commonly useful. For images that contain substantial areas of constant color, though, a linear histogram will often be dominated by a single bar, and a logarithmic histogram will often be more useful.
- Nastavení rozsahu
-
Statistickou analýzu zobrazenou v dolní části dialogu lze omezit na určitý rozsah hodnot. Rozsah hodnot lze omezit třemi způsoby:
-
Kliknutím a tažením kurzoru přes histogram, od nejnižší po nejvyšší hodnotu požadovaného rozsahu.
-
Přetažením bílého a černého trojúhelníku pod histogramem.
-
Pomocí přírůstkových polí pod posuvníkem (levé pole pro dolní mez rozsahu, pravé pole pro horní mez rozsahu).
-
- Statistiky
-
V dolní části dialogu jsou zobrazeny základní statistické údaje popisující distribuci hodnot ve vybraném rozsahu. Jedná se o průměr, standardní odchylku, medián vybrané části histogramu, počet pixelů v obrázku, počet pixelů, jejichž hodnoty spadají do vybraného rozsahu, a procento těchto pixelů.
-
Mean: the mean value of the interval in the selected channel.
-
Std Dev: Standard deviation. Gives an idea about how homogeneous the distribution of values in the interval is.
-
Median: For example, the value of the fiftieth peak in a 100 peaks interval.
-
Pixels: The number of pixels in the active layer or selection.
-
Count: The number of pixels in a peak (when you click on the histogram) or in the interval.
-
Percentile: The ratio between the number of pixels in the interval and the total number of pixels in the active layer or selection.
-